Product Intelligence
Product Intelligence

Insights Agent
Get instant answers from reviews, sales data, and product attributes. Ask product questions and explore shopper insights in one place. Move faster with AI-powered intelligence.
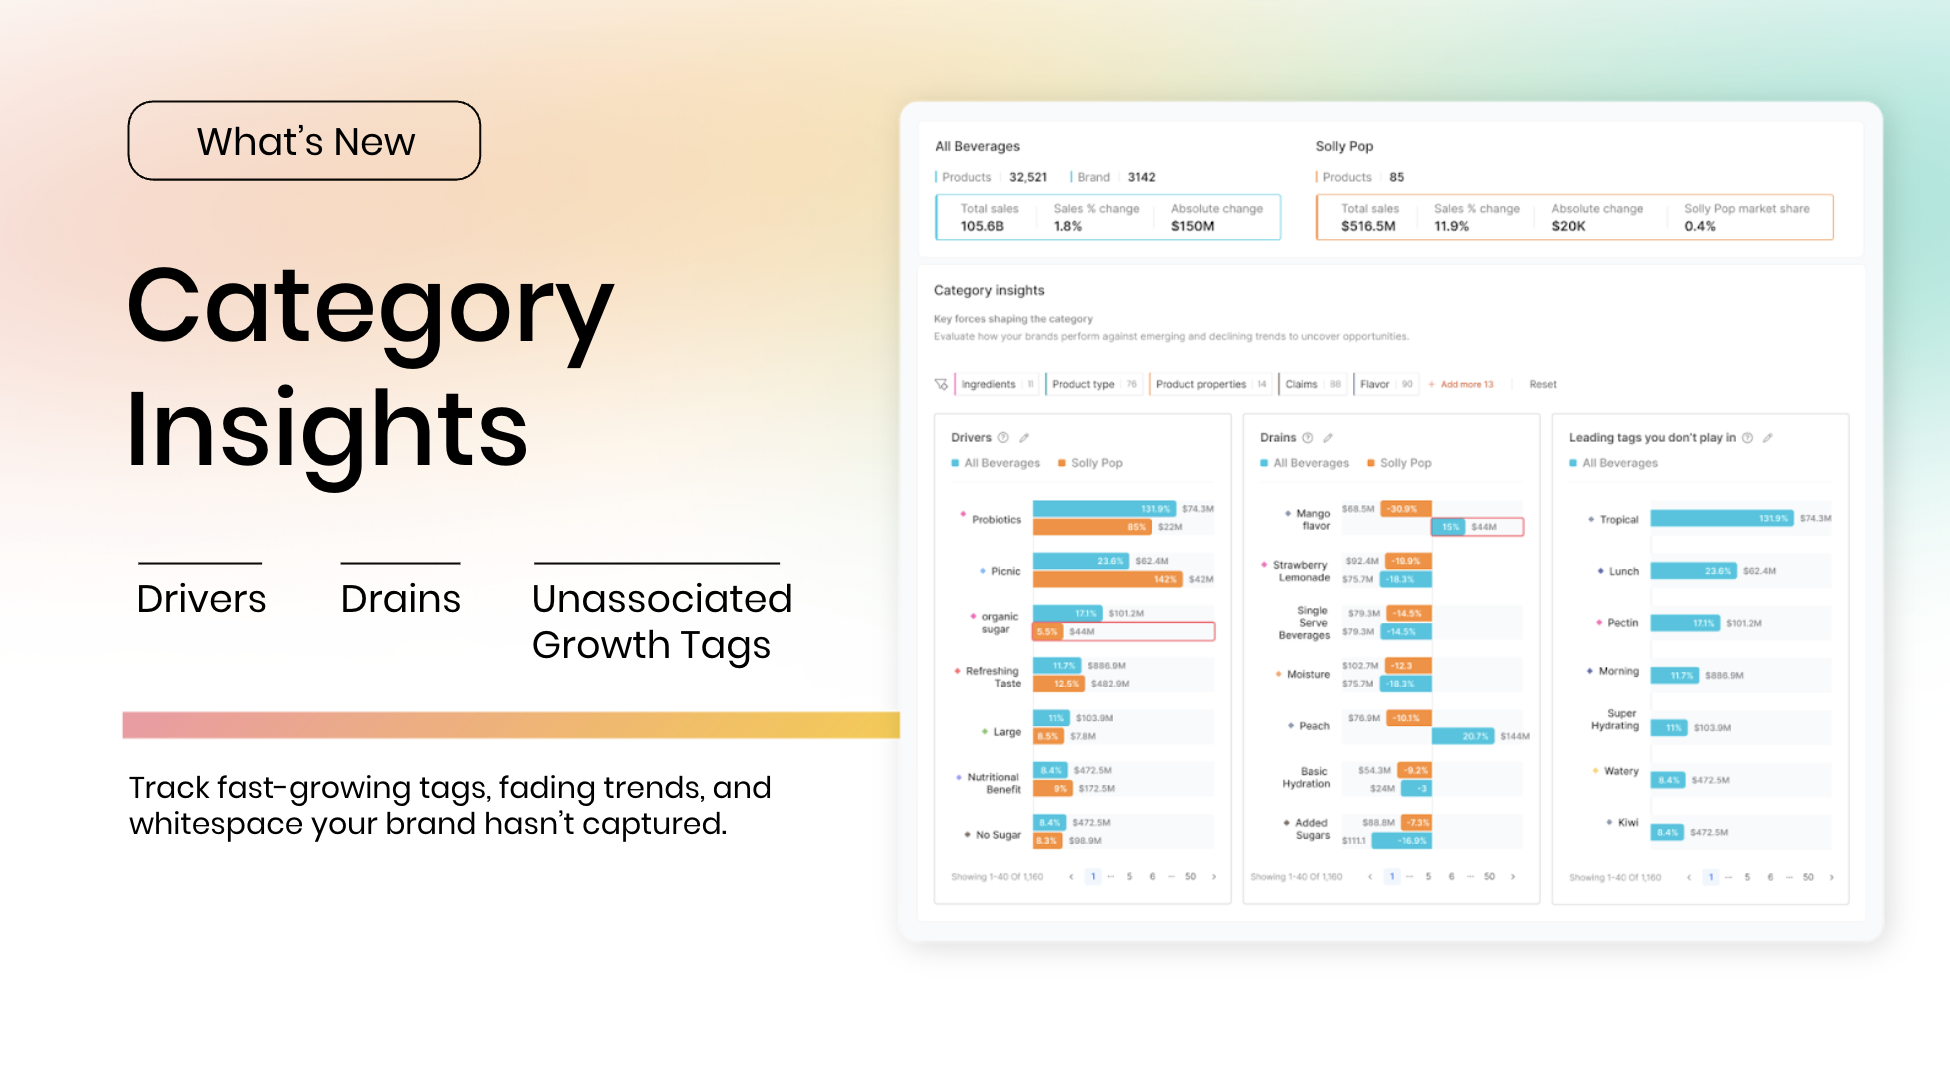
Insights Platform
Explore which attributes drive growth. Validate assumptions with consumer-centric product data. Discover insights before your competitors.

Product Enrichment
Enhance your product catalog with enriched attributes. Make every SKU searchable, segmentable, and insight-ready by using real-world language from shoppers.

Product Catalog
Structured, consumer-driven product data at the UPC level. Available as a standard Harmonya catalog or a custom catalog mapped to your team's attribute schema.
Assortment Optimization
Build smarter assortments with real shopper data to identify what drives demand and where to grow share.

Promotion Planning
Plan promotions using shopper data to identify which products to feature, where to activate, and how to maximize lift.

Brand Messaging
Use shopper language from reviews and PDPs to guide claims, headlines, and message direction.

Shopper Insights
Turn consumer reviews into real-time shopper insights that explain the "why" behind product performance.
Product Dictionary
Establish a shared product reference grounded in shopper language.

Retail Media Optimization
Target more precisely with tags based on real shopper language-boosting relevancy across paid media.

Retailer Omnichannel Strategy
See what products are available across retailers and channels-even when UPCs or listings are inconsistent.

Blog
Quick takes on product data, category trends, shopper behavior, and practical applications of Al in commerce.

Whitepapers
Actionable content for insights, marketing, and ecommerce teams looking to level up their product data game.

Videos
Short videos that break down how Harmonya works and how teams use it.
Case Studies
Read how leading CPGs and retailers are applying Harmonya to make faster, better decisions.
Webinars & Events
On-demand and live sessions with industry pros and Harmonya users. Insights, strategies, and sharp takes welcome.
How It Works
How It Works


Get a Demo
Get a Demo
.png)