One view of what drives your category
You have sales data, survey data, and trend reports. At the product level, none of them agree.
Product Intelligence describes every product in your category the same way, so the same question gets the same answer in every system.
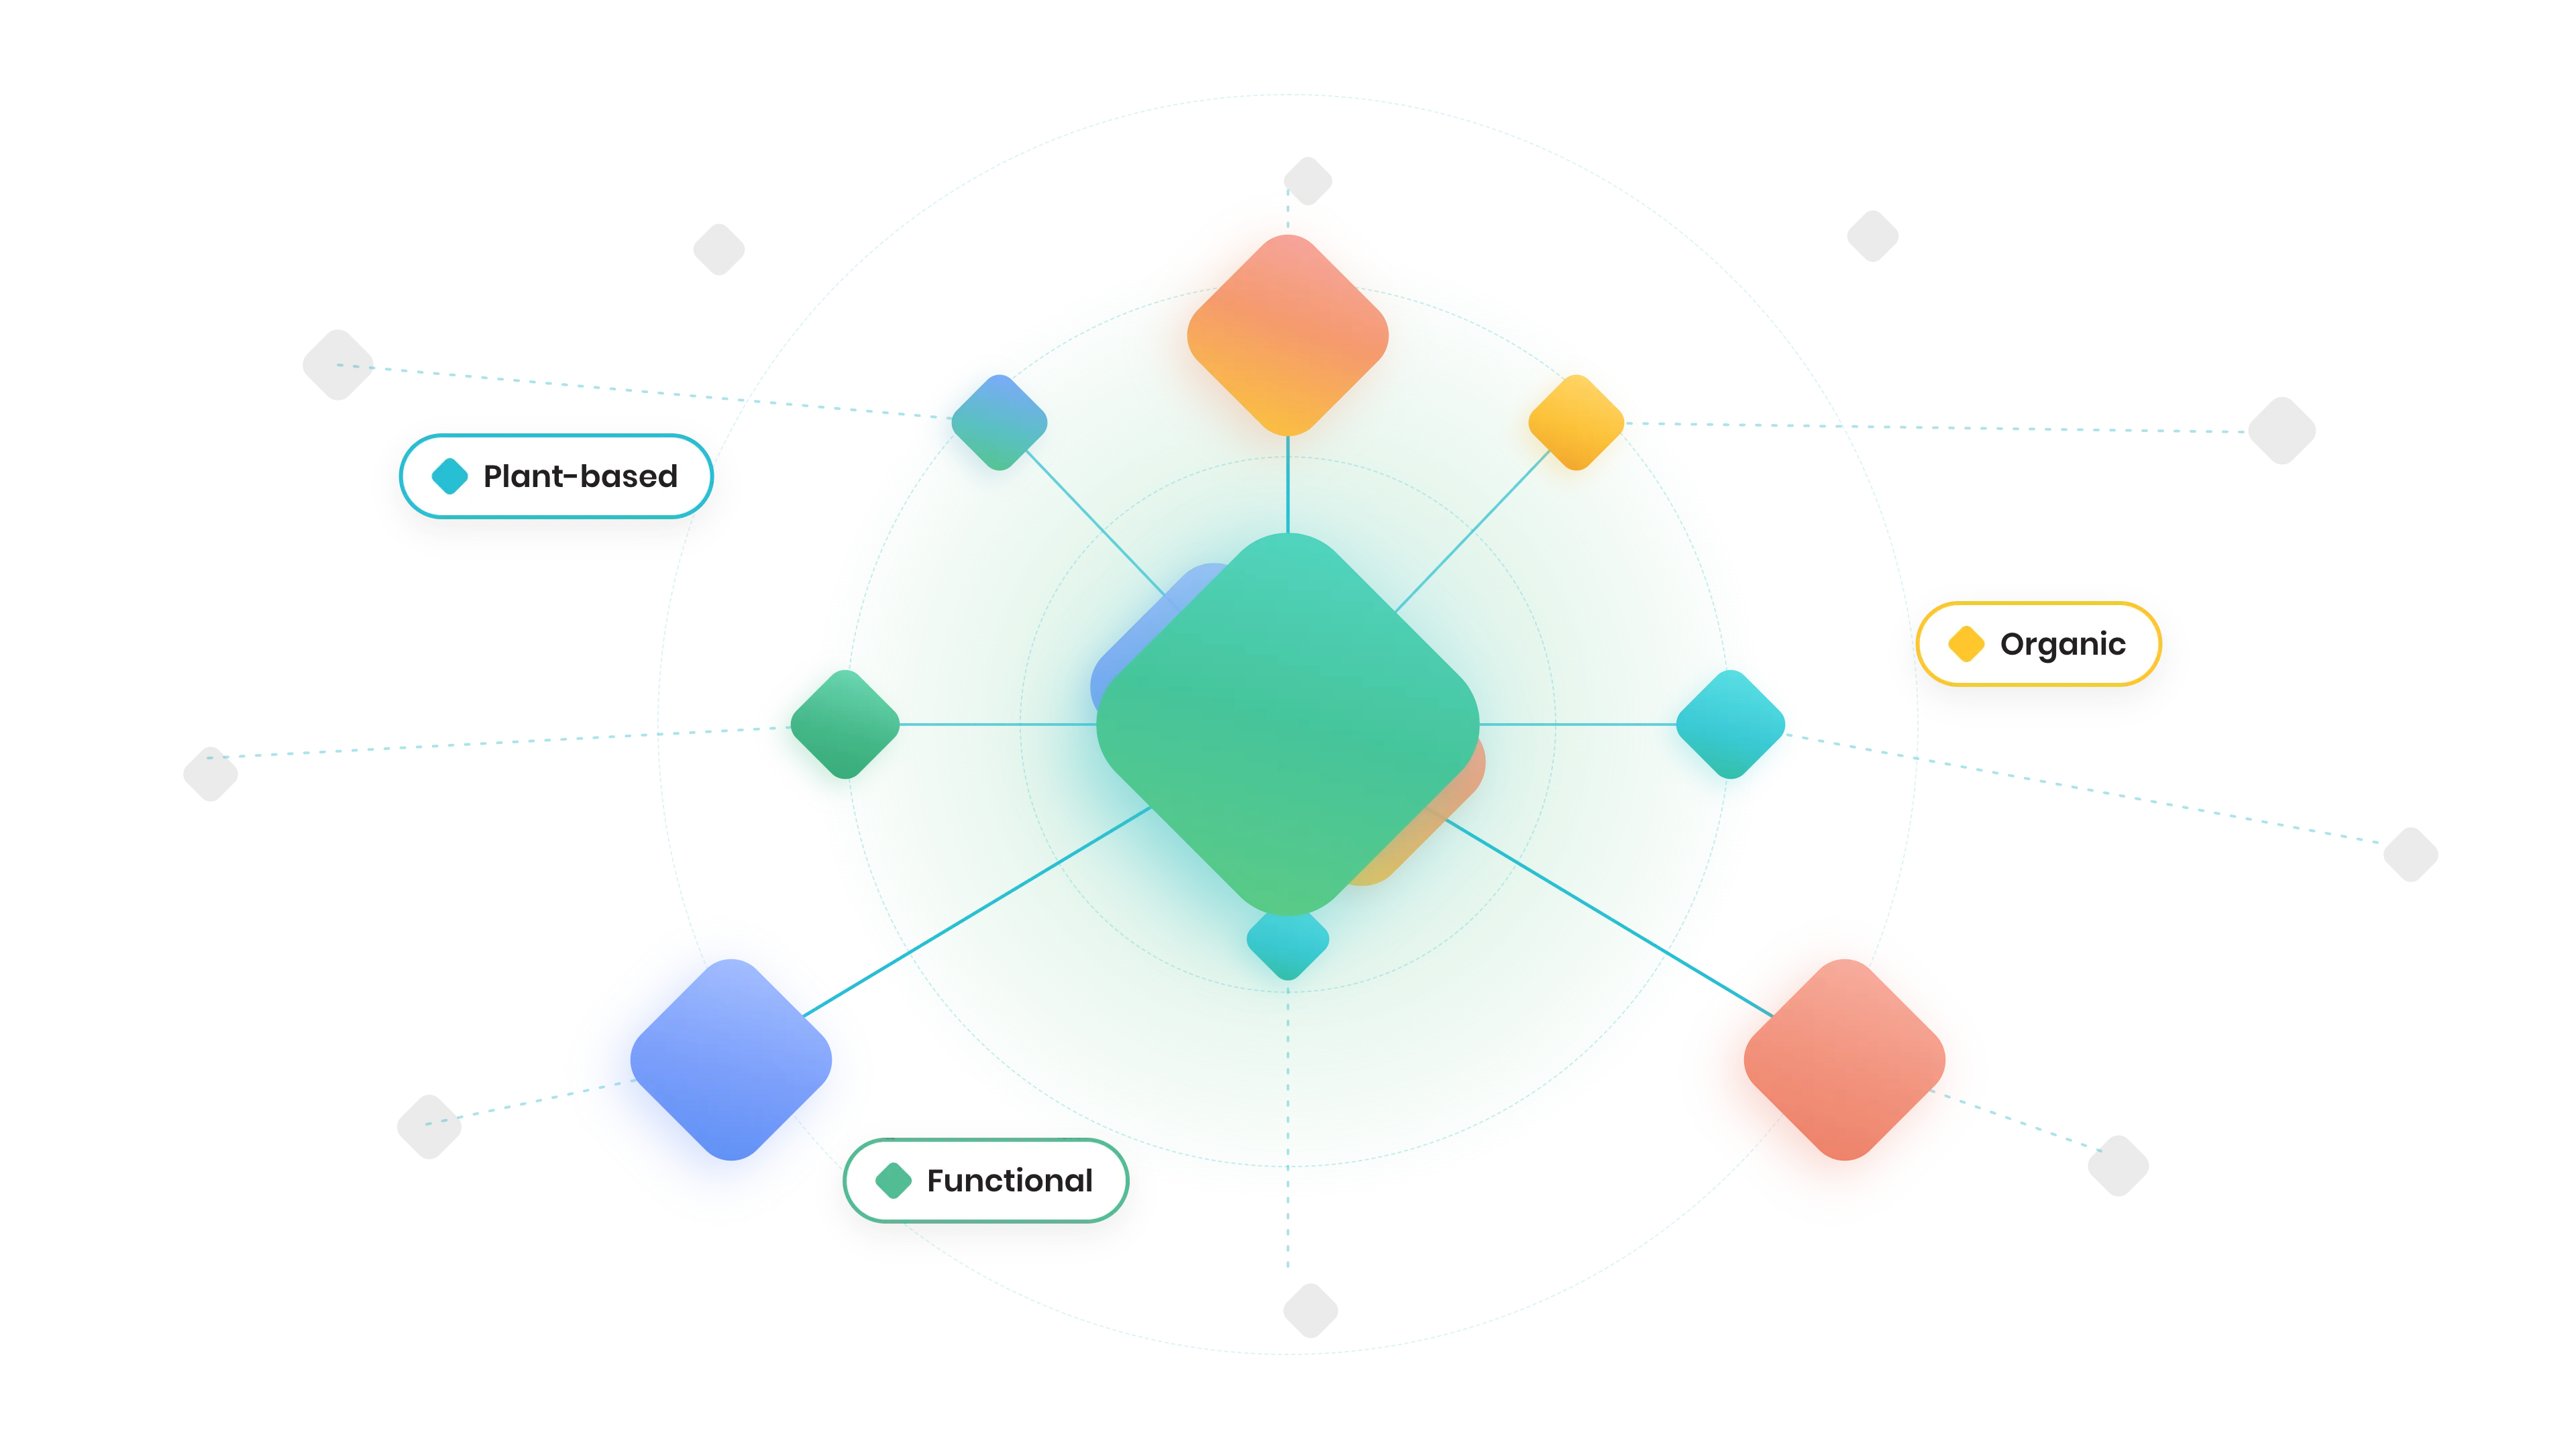
The same definitions, applied to every product in your category
We collect the product pages and shopper reviews for every product in scope, and match them to one UPC. Large language models then code that product against the definitions and taxonomies we maintain.
- Product pages across retailers
- Shopper reviews
- Pack images
- Ingredient lists and nutrition panels
Our acquisition engines use a mix of collection methods.
Brand Northfield, flavor Sea salt, pack size 6 oz, cooking method Kettle cooked
Dietary needs Gluten free, occasion On the go, texture Extra crunchy
Demand space Everyday indulgence, protein level Low
Four of these values come from the title. Nine are attached to the product.
- Attributes attached at the UPC
- In our taxonomy, or mapped to yours
- Measured coverage and accuracy
Refreshed on a schedule agreed with you.
We maintain the attribute catalog on its own track. We define what each attribute means and the values it can take, and we add new values as a category picks them up.
Go deeper on any of the three
Three ways in, one set of attributes
Every engagement runs on the same product attributes. Where you start depends on the question you brought.
Each route reads the same attributes on the same products.


Where teams apply it
Three questions teams bring us most
Innovation Pipeline
Size the demand themes in your category and see which are growing, so innovation work points at demand that is already there.
Brand Messaging
Shoppers describe your products in their own words. Those words become attributes, so claims and headlines get built from what the market said.
Assortment Strategy
See which attributes are under-represented on shelf against the demand for them, retailer by retailer.
What teams have found
Three engagements, and what they sized.
6 months
Coca-Cola
Coca-Cola's shelf strategy team used attribute-level demand to find gaps between what shoppers were asking for and what was on shelf, and turned those into recommendations for their retail partners.
$1.2B
RTD Coffee Category
A leading RTD coffee manufacturer used demand theme mapping to uncover $1.2B in whitespace opportunities by identifying emerging flavor and functional attributes that competitors hadn’t addressed.
$300M+
Global CPG: Protein & Nutrition
A global CPG company applied the Theme Maturity Curve across their protein and nutrition portfolio, identifying $300M+ in addressable demand tied to emerging functional claims and prioritizing innovation investment where consumer pull was strongest.


See what Product Intelligence looks like for your category
A walkthrough of the demand themes in your category, and where your brands sit against them.